Energy Profile Diagrams
An energy profile diagram is a representation of the progress of a reaction, and the energy consumed and released by a reaction.
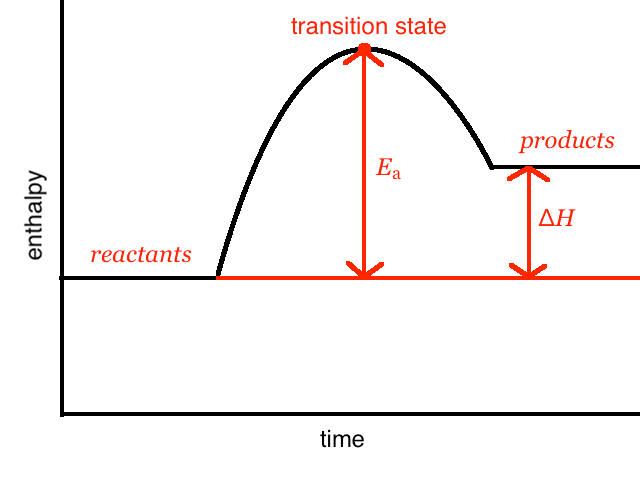
Below is a sample energy profile diagram. Of course you would put scales on the axes, but this was created with software that was not designed with the express purpose of drawing energy profile diagrams.
Enthalpy is a measure of the total content of heat of a system.
In the diagram above we can see that the reaction is endothermic (absorbs energy) because is positive, i.e. the products have more energy than the reactants, meaning energy has been absorbed from the surroundings.